2022 was a great year for the @realty network with nearly $3 Billion worth of properties sold creating 17,500 happy clients throughout Australia and New Zealand.
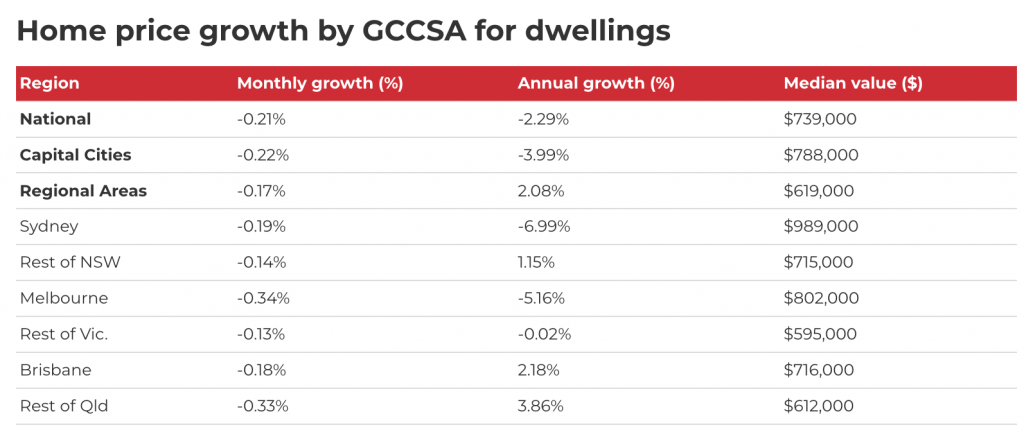
The PropTrack Home Price Index shows that national home prices continued to fall in December, declining by 0.21% over the month.
More expensive markets seeing larger price falls
At a national level, property prices have seen nine consecutive months of price declines. Combined capital city prices have fallen 5.18% from their peak, while combined regional prices are down 2.37%.
While prices are still tracking down, the rate of decline has slowed in recent months. In part, this is likely due to a reduction in the magnitude of the interest rate rises seen since October.
Unsurprisingly, the impact of higher interest rates on property price falls has been more substantial for more expensive markets and property types.
Sydney, Melbourne, and Canberra – Australia’s three most expensive capitals – saw the sharpest price declines in 2022. Conversely, price falls have been smaller in the more affordable cities of Adelaide, Perth, and Darwin.
Houses have also recorded larger price falls in comparison to units. Nationally, unit prices have dipped by 1.72% over the past 12 months, while house prices are down 2.4%.


Canberra leads price falls in December, Adelaide sees first decline
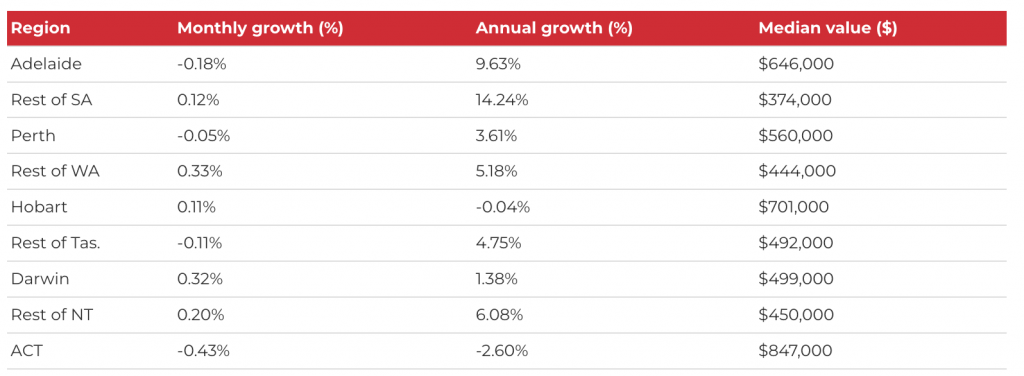
Canberra saw the largest decrease of any market in December, with prices falling 0.43% over the month. Melbourne followed, with prices dipping by 0.34%.
Darwin was the strongest performing market in December, recording price growth of 0.32%, while Hobart also saw values rise, up 0.11%. Despite the monthly lift, prices in both markets remain below the peak levels achieved earlier in the year.
While property prices had been in decline for over six months in most of Australia’s capital cities, Adelaide had, until recently, bucked the trend. In December, however, the city recorded its first notable price drop, with values falling by 0.18%.
Despite the December drop, home prices in Adelaide remain 9.63% higher compared to 12 months ago – the highest level of annual growth seen in any capital city.
In contrast, property prices in Sydney are 7.23% lower compared to 12 months ago – the sharpest decline of any capital city, followed by Melbourne (-5.96%) and Canberra (-5.05%).

Regional areas outperform, though performance is mixed
Regional markets have outperformed their capital city counterparts in every state over the past 12 months.
Comparing year-on-year, Australia’s combined regional areas have recorded home price growth of 2.08%, while combined capital cities saw a fall of 3.99% over the same period.
While regional home prices are up from 12 months ago, they are not immune to the pressures of rising interest rates, with many regions recording price falls in recent months.
Regional Victoria and New South Wales have seen the largest drops, with prices sitting 3.02% and 2.90% below their peaks respectively.
In contrast, regional South Australia and Western Australia have continued to see prices grow, reaching new peaks in December.
Several factors are supporting the outperformance of the regions. First is the relative affordability of regional areas in comparison to capital cities. Many buyers in search of larger dwellings have been priced out of capital cities and they are looking further afield.
The increased prevalence of remote and hybrid working practices has also enabled many buyers to live further from their workplaces.
Lack of supply is another factor that has supported regional property prices. The total supply of properties listed for sale in regional markets has moved steadily downward over the past decade – a trend that accelerated over the pandemic due to the boom in demand for regional living.
This has led to high levels of buyer demand relative to the supply of properties for sale in many markets which has supported price performance.

South Australia dominates the highest growth regions
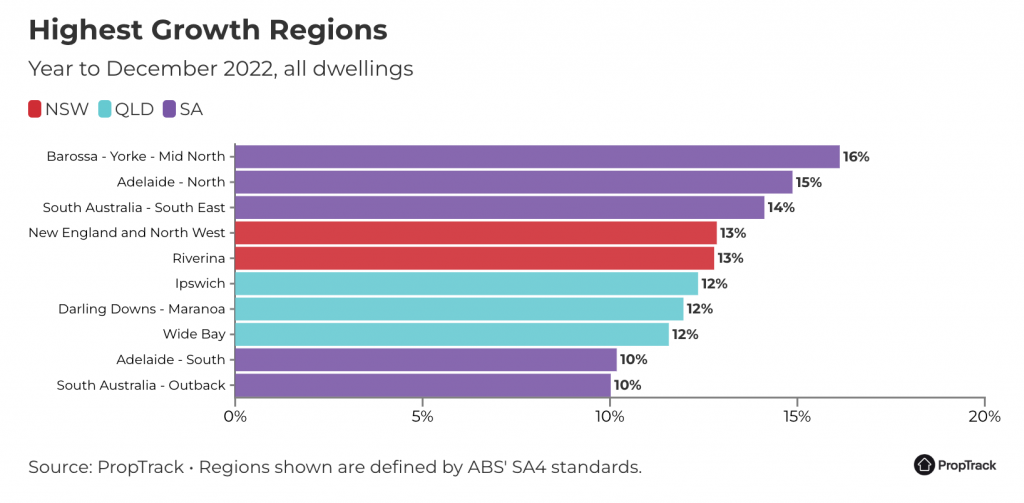
Five of the top ten highest growth regions over the past 12 months can be found in South Australia. Adelaide was also the only capital city to feature in the top ten.
The Barossa/Yorke/Mid North region topped the national list, having seen annual home price growth of 16%, followed by Adelaide North at 15%.
The dominance of South Australia marks a shift from the trend seen just six months ago when Queensland accounted for the bulk of high growth regions.
The relative affordability of South Australian real estate in comparison to other states is a factor here. With buyers on average borrowing less to purchase in South Australia, the relative impact of higher interest rates is more subdued compared to other markets.

Outlook
Interest rates were increased for the eighth consecutive month in December in what has been the fastest spate of rises seen since the 1980s.
Just as interest rate cuts were the primary driver of the rapid home price growth seen over 2020 and 2021, rate rises were the primary driver of price declines in 2022.
As of December, interest rates were sitting at the highest level seen in just over a decade, placing significant strain on borrowers.
Over the course of 2022, the average buyer has seen their borrowing power slashed by around 25%, significantly impacting what many are able to afford.
While interest rates are likely at or close to their peaks, the Reserve Bank has signalled the potential for more increases in 2023. Should rates move higher this will further erode borrowing capacities and drive home prices lower.
However, once interest rates peak, we are likely to see prices stabalise. Moreover, Australia’s growing population combined with a slow down in the rate at which new dwelling stock is being constructed is likely to put a floor under price falls.
Source: click here
